Node metrics: the six proposed changes
For PR 19760, which fixes issue 16247
I built changes 1 to 5 on a separate branch and deployed it, so every picture and video here is the real page, not a mock-up. Nothing is pushed: PR 19760 and its preview are as they were. Each change is its own commit, so you can keep some and drop others.
- TodayPR 19760 as it is now.
- ProposedPR 19760 plus changes 1 to 5. All of them are always on, so the info icons from change 2 appear in the pictures for other changes too.
- Real data comes from a real cluster, with usage and pod requests held at one moment so Today and Proposed compare fairly.
- Simulated means a real cluster's data was changed in my test browser only. No cluster was changed.
The links at the top use the mf Rancher, so log in as usual. They show real data, so the simulated cases in changes 3 and 4 only appear in the pictures and videos. Node IPs are blurred, and the label rows are hidden in the pictures of the Nodes list. Click a picture to see it full size.
| # | Change | What you'd notice | Tested on |
|---|---|---|---|
| 1 | The same card on node detail | Node detail looks like the dashboard. No more Used 0% without metrics. | Real data |
| 2 | Explain Used and Reserved | An info icon next to each, on both pages. | Real data |
| 3 | EKS uses real metrics | Nodes list and node detail stop showing pod requests as usage. | Simulated |
| 4 | Cluster Used counts only nodes reporting | Used no longer looks low when a node goes silent. A note says so. | Simulated |
| 5 | Two clean-ups | Nothing. A smaller PR. | Code only |
| 6 | Update the PR description | Nothing in the UI. Reviewers are told about the older fix it reverses. | Text only |
The same card on node detail
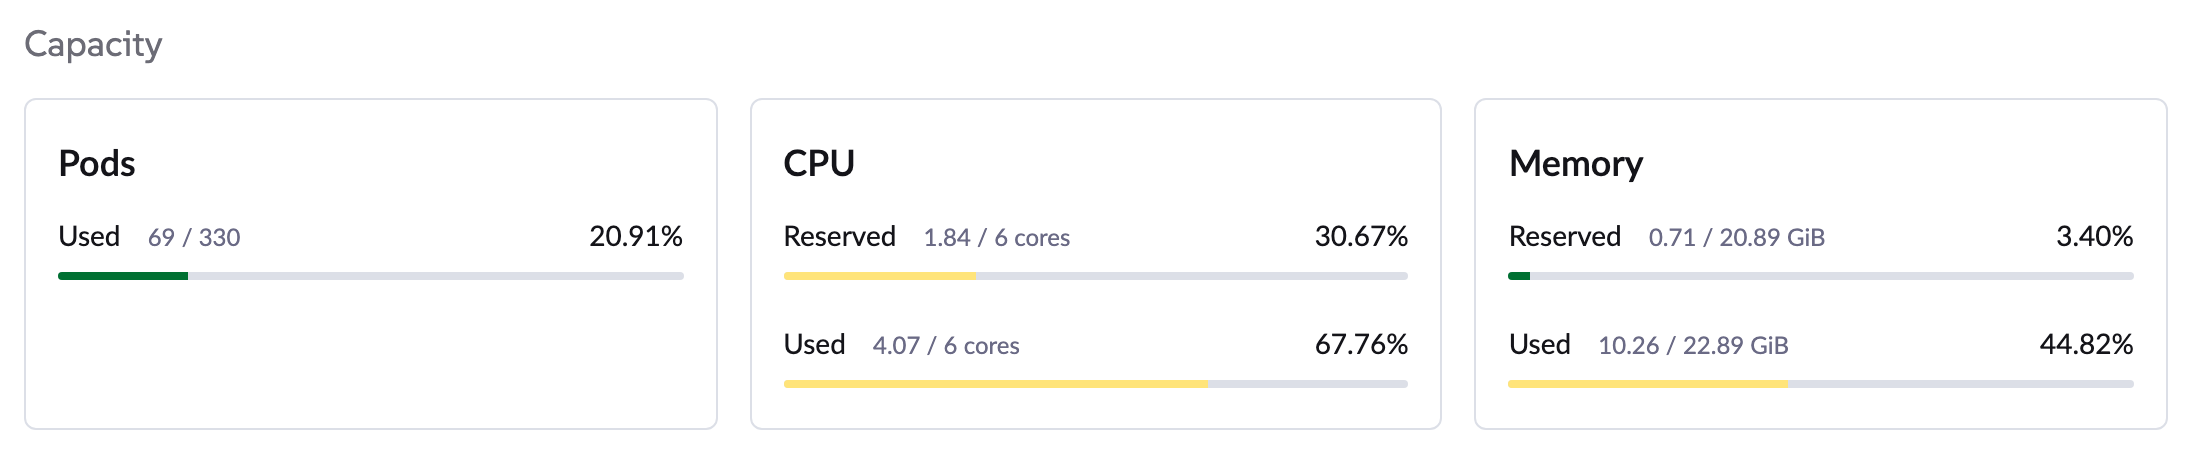
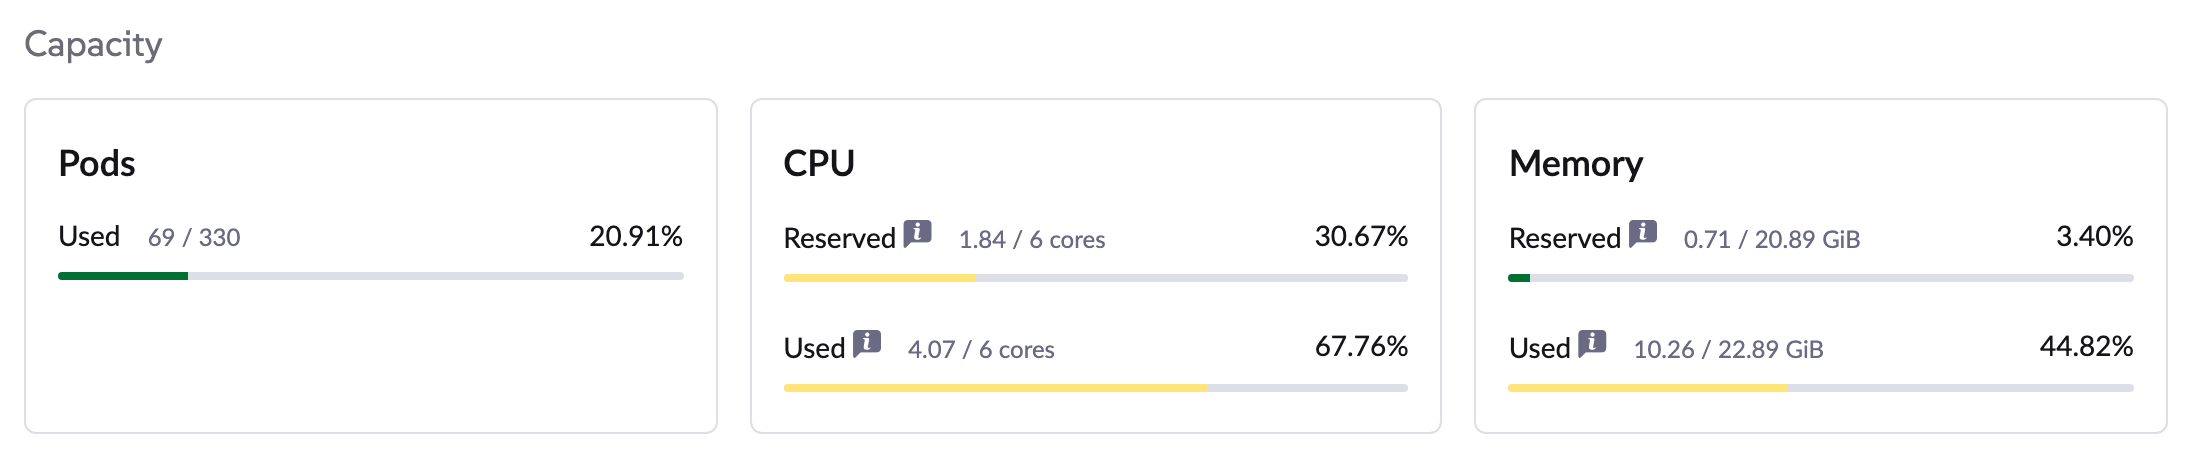
The problem. The issue asks for the same cards on the cluster dashboard and on node detail. Today both show Reserved and Used, but the order, the number format and the colours are all different. Also, a node with no metrics says Used 0% on node detail, as if it were idle, while the Nodes list says n/a and the dashboard leaves Used out.
The change. Node detail uses the dashboard's card. Same order (Pods, CPU, Memory), same format, same colours. Without metrics, Used is left out.
The look
Same cluster and same usage. In Today the two pages look different, and in Proposed they match. The Running count isn't held still, so it can be off by one between pictures.


A node with no metrics
Real: the mf local cluster has no node metrics.


What else changes on node detail
- Colours. Bars turn yellow from 30% and red from 70%, instead of red only above 80%. So a node at 74% memory goes from green to red. The Nodes list keeps its old colours unless you choose otherwise (question 2 in my last message), so that same node stays green there.
- Percentages get two decimals, 37.96% instead of 38%, like the dashboard. The Nodes list still rounds.
- Memory totals keep two decimals, 15.42 GiB instead of 15 GiB, so they add up with the percentage. Each value keeps its own unit,
128 MiB / 5.63 GiB, so the earlier fix for wrong units (PR 18360) stays. - Used appears a moment after the page opens, once the metrics arrive, as it does on the dashboard. Today it shows 0 until then.
- Pods still differ. Node detail counts Running pods, the dashboard counts every unfinished pod. I'd leave that as a follow-up.
Explain Used and Reserved
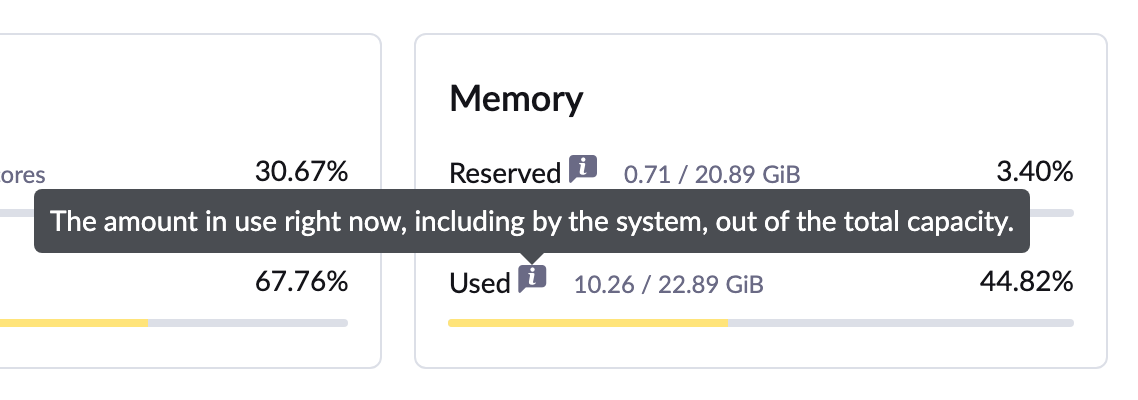
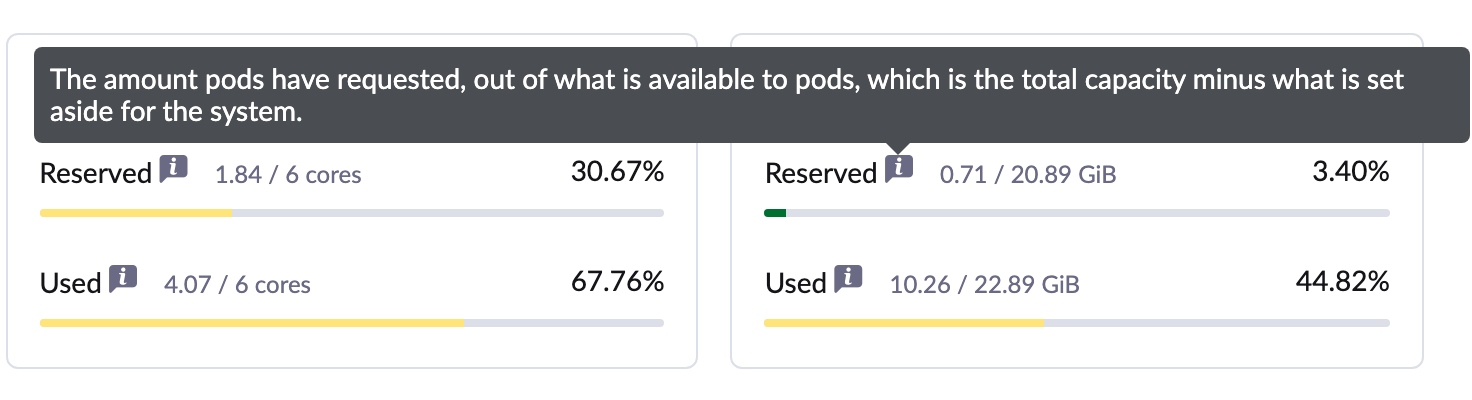
The problem. The issue says it should be clear what usage and reserved mean. Nothing in the UI explains them, and one card now has two different totals: on the longhorn cluster, Used is out of 22.89 GiB and Reserved is out of 20.89 GiB.
The change. An info icon next to Used and Reserved, on the CPU and Memory cards of both pages. It opens on hover and on keyboard focus.
Used: The amount in use right now, including by the system, out of the total capacity.
Reserved: The amount pods have requested, out of what is available to pods, which is the total capacity minus what is set aside for the system.
Worth knowing
- The wording is my draft and hasn't had a UX review. It's the easiest part to change.
- Pods has no icon, because it's a different count.
- The text is optional on the card, so other pages using it don't change, such as the Harvester dashboard.
EKS uses real metrics when it has them
The problem. For EKS clusters created from the UI, the Nodes list and node detail show what pods requested as the usage, even when real metrics exist. The dashboard uses the real metrics, so the pages disagree, and on node detail Reserved and Used are the same number.
That comes from a 2022 fix (PR 6915) for clusters with no metrics. But it only checks that the cluster is EKS and was created through Norman, and the UI creates every EKS cluster through Norman.
The change. Use the metrics when they exist. Fall back to pod requests only when there are none.
| Nodes list, CPU of the 2 nodes | Node detail, CPU Reserved and Used | Dashboard, CPU Used | |
|---|---|---|---|
| Today | 82% and 53% | 53% and 53% | 20.19% |
| Proposed | 8.8% and 26% | 53% and 26% | 20.19% |




Worth knowing
- This is the riskiest of the six, because no real EKS cluster is available to me. That the UI creates them through Norman comes from reading
CruEKS.vue. If someone has a real one, it's worth a look. - Without any metrics, nothing changes: the Nodes list and node detail still show pod requests, and the dashboard leaves Used out. That's the case PR 6915 was for, so I kept it. On that kind of cluster, Reserved and Used stay identical, as below.

Cluster Used counts only nodes that report metrics
The problem. When a counted node stops reporting metrics, for example because it's NotReady, its usage goes away but its capacity stays in the total. So the cluster looks less busy than it is.
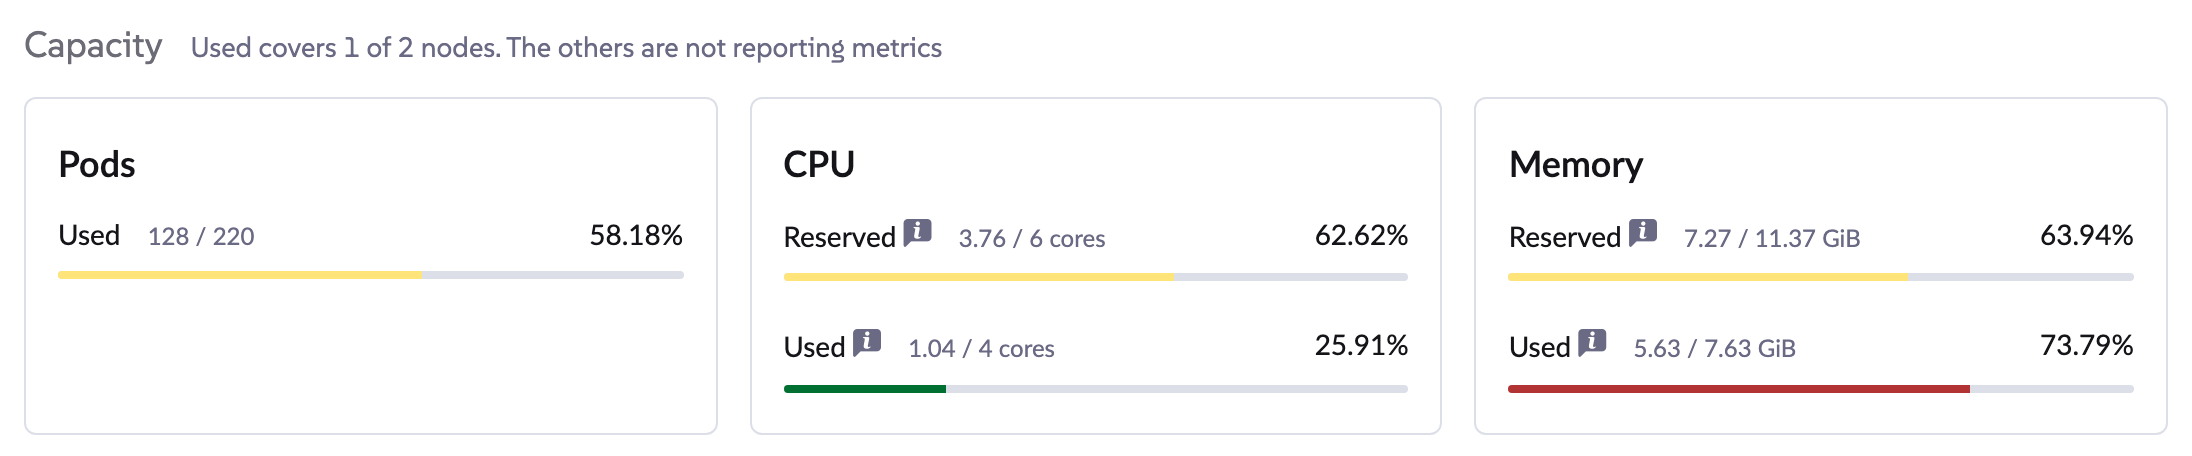
The change. Used adds up usage and capacity only for the nodes reporting metrics. When some don't, a note next to Capacity says so. The note is new: it wasn't in my list, I added it because otherwise the total changes with no explanation.
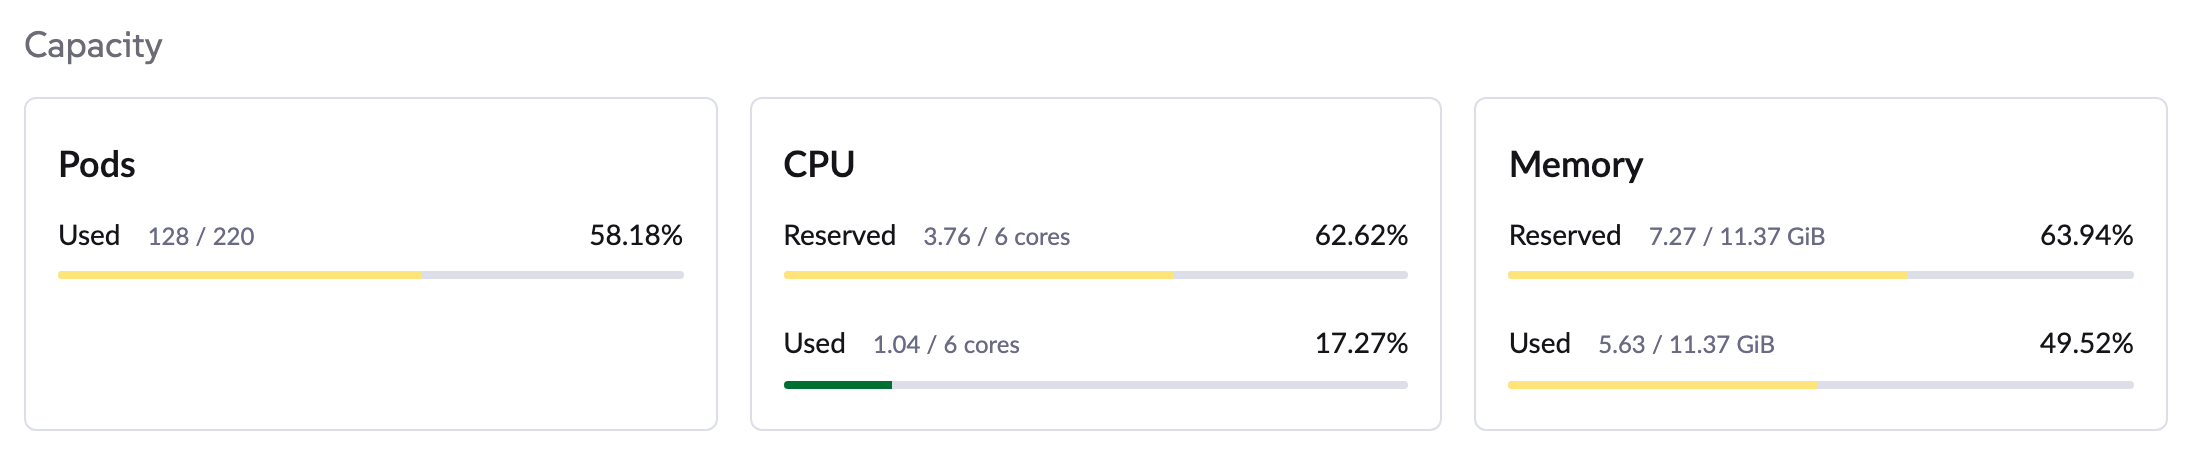
| Dashboard, Memory Used | Dashboard, CPU Used | Nodes list, the node reporting | |
|---|---|---|---|
| Today | 5.63 / 11.37 GiB = 49.52% | 1.04 / 6 = 17.27% | RAM 74%, CPU 26% |
| Proposed | 5.63 / 7.63 GiB = 73.79% | 1.04 / 4 = 25.91% | RAM 74%, CPU 26% |

Worth knowing
- Reserved still covers every counted node, because pod requests don't come from metrics. So Reserved and Used can cover different nodes, which is what the note is for.
- The dashboard says 73.79% and node detail says 73.75% for the same node. The dashboard rounds to GiB before dividing. That was already there and I left it.
- I simulated this. I didn't stop a real node.
Two clean-ups
Nothing changes on screen, so there's no video. These only make the PR smaller and easier to review.
Remove the clamp I added to the bar
I clamped the width in Bar.vue because Used could go negative, and a negative width drew a full bar. Used has nothing subtracted now, so it can't go negative. Bar is shared with other pages, so it's better to leave it exactly as it is on master.
Reserved can still go over 100%, but the bar already clips that. Below, without the clamp, 110.14% stops at the end of the bar: the coloured part is 344 px wide inside a 313 px bar, and the extra is cut off.

Simplify the rule for which nodes count
The roles list only repeated the check. The result is the same, and the same 11 test cases pass.
const roles = [ETCD, CONTROL_PLANE, CONTROL_PLANE_OLD, WORKER];
const isWorker = WORKER in this.labels
  || !roles.some((role) => role in this.labels);

if (isWorker) {
  return true;
}

const serverRoles = [ETCD, CONTROL_PLANE, CONTROL_PLANE_OLD];const serverRoles = [ETCD, CONTROL_PLANE, CONTROL_PLANE_OLD];
const isWorker = WORKER in this.labels
|| !serverRoles.some((role) => role in this.labels);
if (isWorker) {
return true;
}Update the PR description
The problem. Reviewers should be told three things that the description doesn't say yet. The first is the important one.
a. Used goes back to capacity, which reverses an older customer fix
In 2023 a customer (issue 7598) set memory aside for the system and found that node detail still showed the node's full memory, while CPU showed the smaller amount left for pods. They expected memory to show that smaller amount too, the allocatable. PR 9014 did that by dividing Used by allocatable. That's why, on master, the same node reads 38% in the list and 51% on node detail.
The PR puts Used back on capacity, so the total on Used is again the node's full memory, which is what that customer complained about. The number they asked for doesn't go away: it's now the total of the new Reserved bar, right above Used. UX asked for exactly that bar in the same issue:
We should add a reserved bar for the memory on the nodes detail page similar to the one on the cluster page.kwwii, issue 7598, February 2023
I think this is the right trade, and it's what Cody asked for, but a reviewer should hear it from us and not find it later.

b. Reserved differs from what the issue suggested
The issue suggested dividing Reserved by capacity. We divide by allocatable, following Cody's recommendation, because pods can only get the allocatable. The description should say that, so it doesn't look like a mistake.
c. The test steps must name the kubectl flag
Plain kubectl top node divides by allocatable, so anyone comparing with it on a node like this one would think the UI is wrong. --show-capacity is the one that matches Used. CPU matches either way here because this node sets aside only memory.
$ kubectl top node longhorn-pool1-r54vx-828jd
NAME                         CPU(cores)   CPU(%)   MEMORY(bytes)   MEMORY(%)
longhorn-pool1-r54vx-828jd   1238m        61%      2881Mi          49%

$ kubectl top node longhorn-pool1-r54vx-828jd --show-capacity
NAME                         CPU(cores)   CPU(%)   MEMORY(bytes)   MEMORY(%)
longhorn-pool1-r54vx-828jd   1238m        61%      2881Mi          36%

$ kubectl describe node longhorn-pool1-r54vx-828jd   (Allocated resources)
  Resource           Requests    Limits
  cpu                480m (24%)  0 (0%)
  memory             128Mi (2%)  0 (0%)
I ran this live, after the numbers in the pictures were frozen, so memory reads 49% and 36% instead of 51% and 38%. The gap between the two is what matters.
The new description
Not posted. It assumes you keep all of changes 1 to 5, and I'd adjust it to what you pick. removed added
What I checked, and what I didn't
| Check on the proposed branch | Result |
|---|---|
| Full unit test suite | 868 suites passed, 15,971 tests passed |
| Type check | No new errors (baseline 301, now 300) |
| Lint on the changed files | Clean |
| No access to nodes (stubbed, not a real project member login), or the node list fails | Reserved and Pods still show, without Used |
| Node list slow to load | Reserved and Pods show first, Used appears once the nodes have loaded |
| Node detail's Used follows the 30-second metric refresh | Yes: went from 25.00% to 75.00% when the metric changed |
| Tooltips open with the keyboard | Yes, on focus |
| Browser errors on the pages above, on all previews | None |
| Dark mode | Looks fine |
Not checked: a real EKS cluster, a real node stopping, a real project member login, and the Harvester dashboard with the changed card (nothing it passes changes, but I didn't run it).
What I need from you
- Which of 1 to 6 to keep. I'd keep all six. Then I'd move those commits onto PR 19760 and update its description. If you drop one, I remove its commit.
- The two smaller questions from my last message are still open and not on this page: the colours of the Nodes list bars, and the QA label on the issue.
Full code of changes 1 to 5: the diff. One commit each: change 1 71e3e8750, change 2 9c0a7c4e6, change 3 c0de5d000, change 4 016eb8ec7, change 5 ba77892c3. Local branch node-metrics-proposal, not pushed.